
Marginal CPA: The Most Overlooked Metric in Media

I’ve been in marketing for ten years now, and some of the most painful lessons I’ve learned could have been avoided with just a liiitttle bit of information on marketing finance concepts. I want to help all of you avoid those bruises! One of the simplest and most overlooked concepts is also one of the most important. Marketers tend to gloss over it, but your CFO definitely does not. It’s called marginal acquisition cost, or marginal CPA. Let’s get into it.
Marginal Acquisition Cost aka ‘the cost of your next sale’
New marketers tend to use their LTV as a CPA target because it makes sense on the surface.
Value > Cost = Good, right?
A phrase I’ve heard many marketers say is “Our LTV is $100, so our CPA needs to be below that to breakeven”.
To that, my response is:

After LTV, the very next thing to factor into any media target is diminishing returns. In a well-optimized program, each additional sale becomes more expensive. That means if your CPA target is set equal to your LTV, your latest sales are likely costing more than they are worth.
Take the below scenarios as an example:
LTV = $400
Scenario 1: Total CPA target is $400 (because you want to maximize volume at or below the LTV).
Scenario 2: You’re only willing to pay $400 for any given sale so that you are always ROI positive.
The main point of the below graph is to show that as spend increases, sales don’t increase at the same rate. However, the total CPA stays low because more expensive sales are weighed down by the less expensive ones.
The question every marketer is trying to answer is: When do we stop spending?
It depends on your specific goals, but a safe place to stop is when ‘marginal cost’ > ‘LTV’
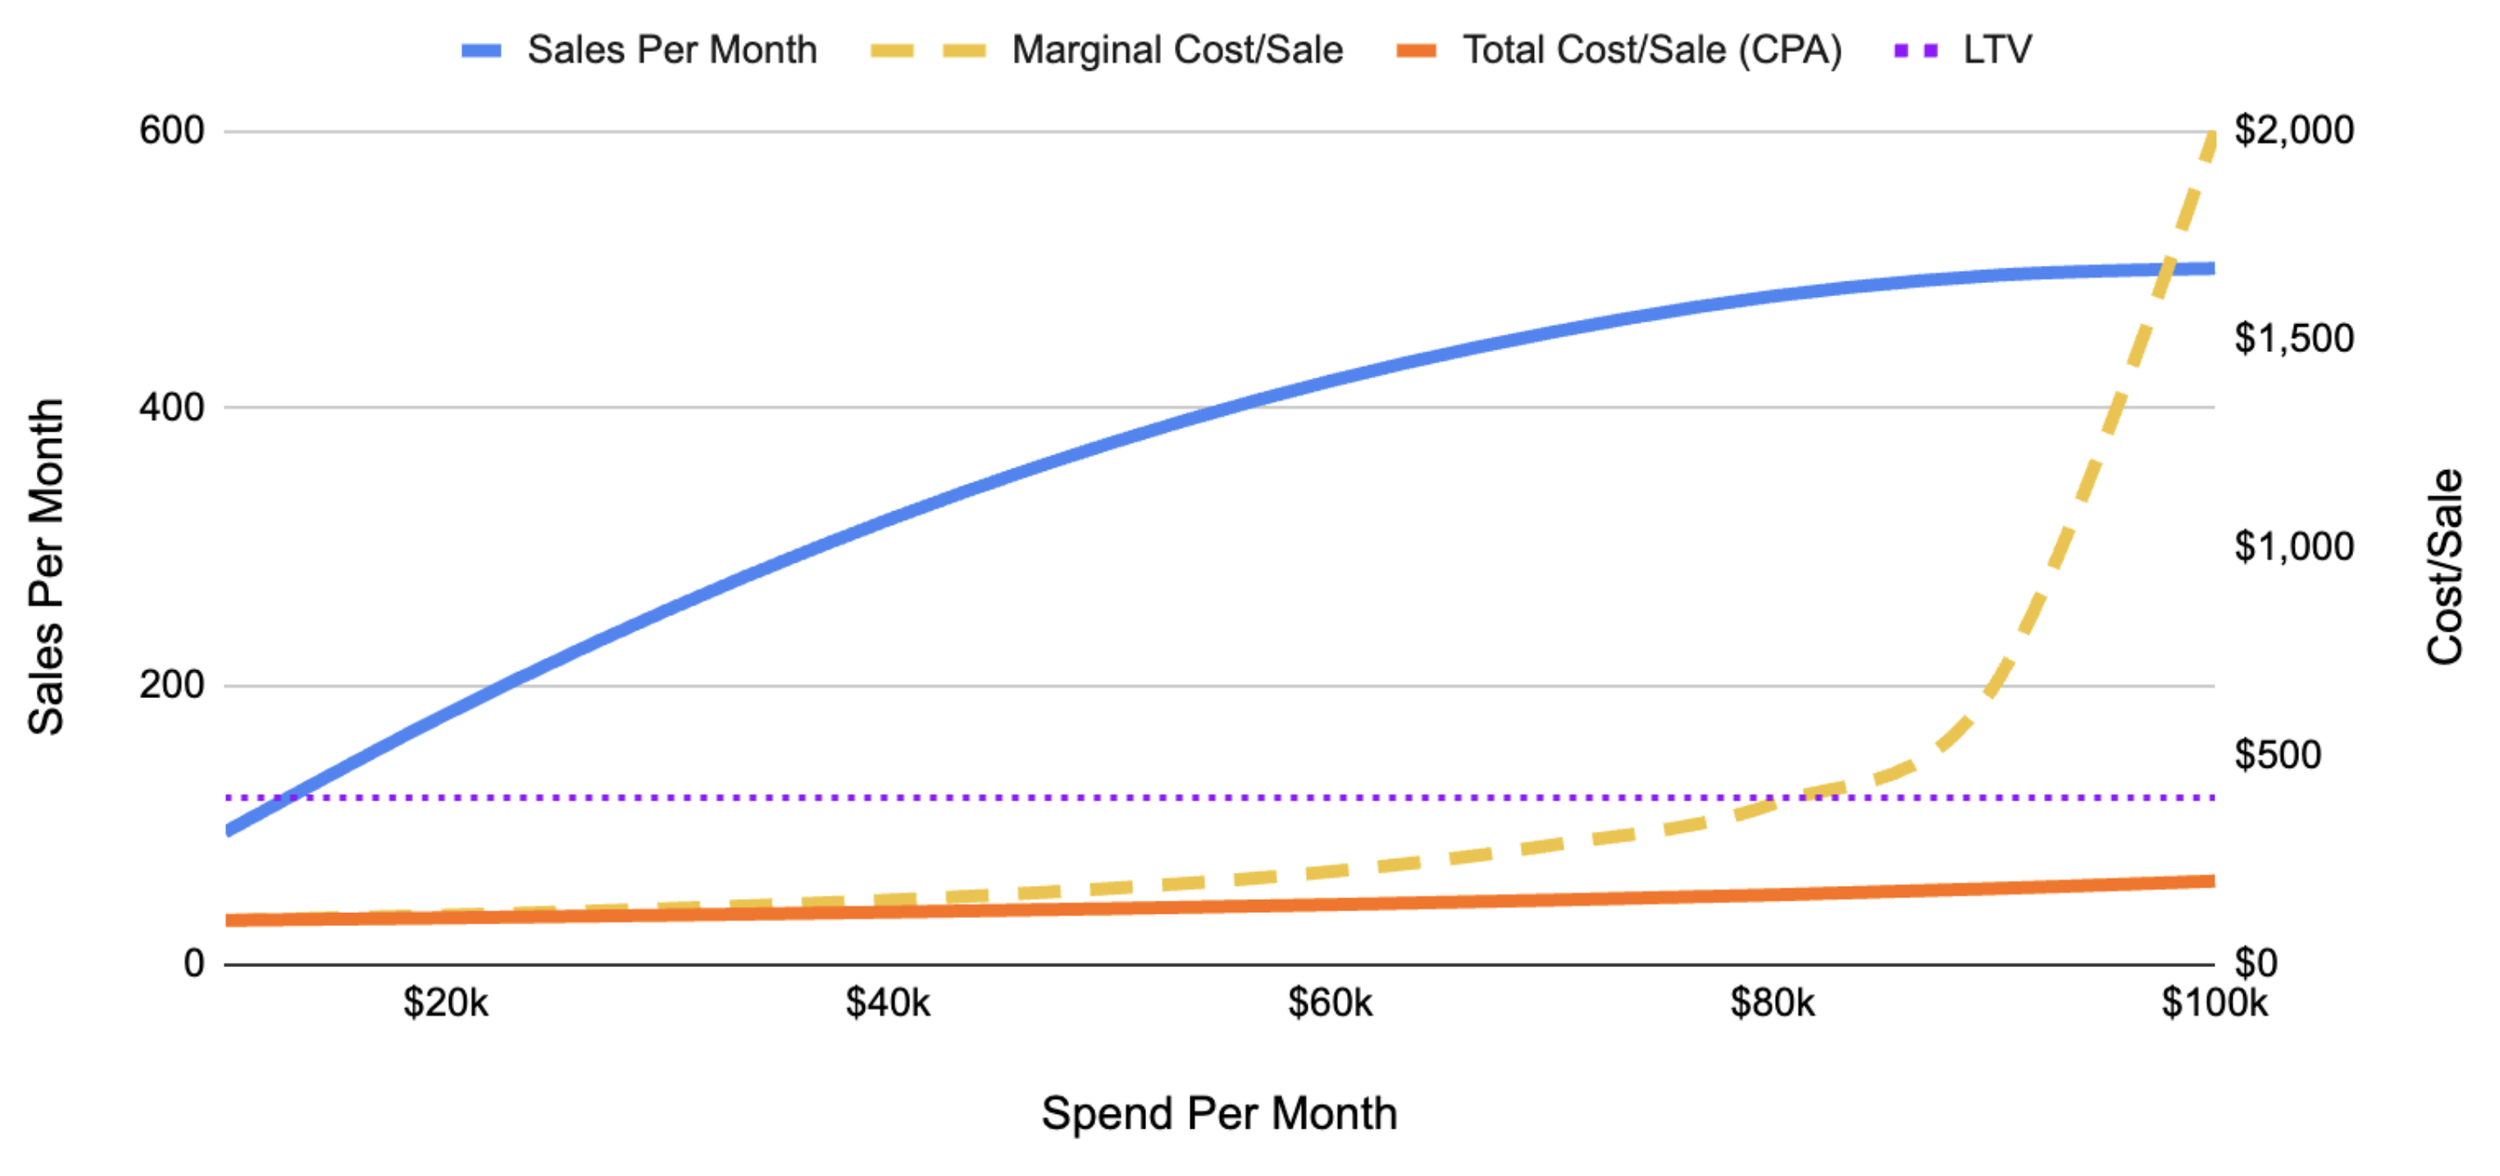
Here is the same information in chart form (remember we have a $400 LTV):
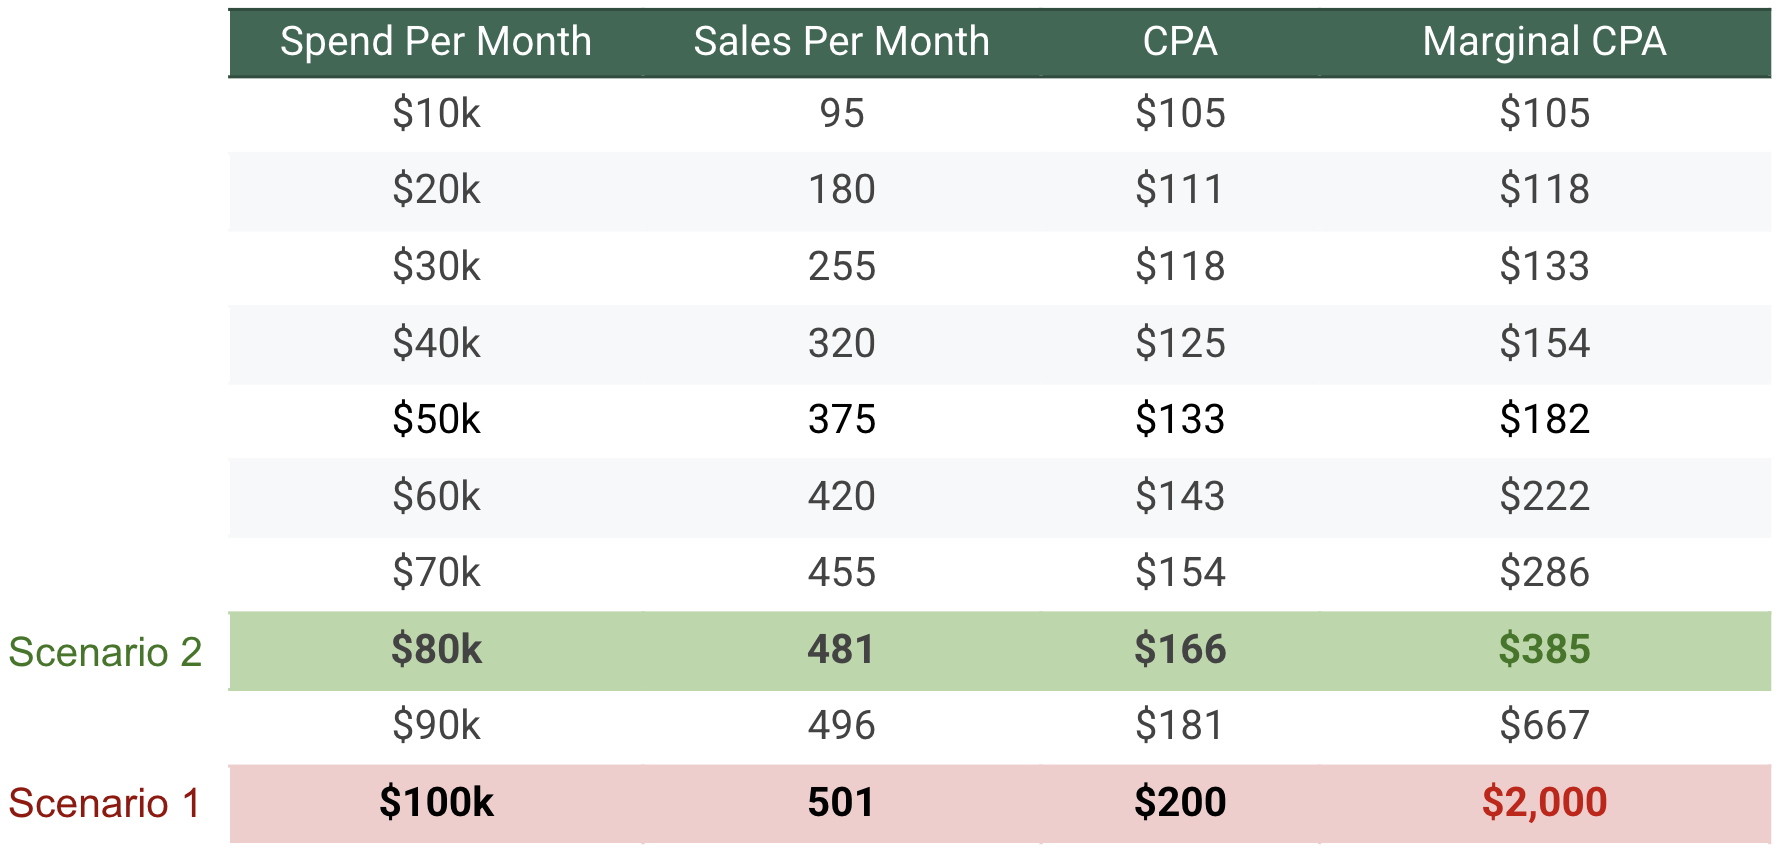
In scenario 1 your CPA never even reaches your $400 LTV, so you are ‘ROI positive’. However, the marginal CPA (cost of the next sale) is $2,000. I can fairly certainly say nobody wants to pay $2,000 for a $400 sale.
In scenario 2, if you set your CPA at $166 then you are in a much more financially viable situation. Yes, you are spending 20% less, which is sad if your goal is to spend as much money as possible (?). Nevertheless, your next sale will only cost ~$385, which is obviously less than the $400 LTV. This means that every sale is making money, and your expensive sales aren’t just weighted down by the cheaper ones.
Understand this concept, and you are going to be the CFO’s best friend.
The obvious next question is how does one actually do this? I assure you it’s one of the simplest things you can do in Google Sheets or Excel.
I’ve included an example in a Google Sheet
Step 1: Organize Your Data into two columns
Column A (Spend): Daily spend levels for the channel you’re evaluating. I typically use 90 or 180 days, depending on what I think represents the current state of performance.
Column B (Conversions): Daily conversion data for the channel you’re evaluating for the same days as the above spend.
Step 2: Create the Scatter Plot
Highlight your data.
Go to Insert > Chart.
In the Chart Editor panel on the right, under Setup, change the Chart type to Scatter chart.
Ensure ‘Spend’ is the X-axis, and ‘Conversions’ are they Y-axis.
Step 3: Fit the Curve (Trendline)
In the Chart Editor, click the Customize tab.
Expand the Series section.
Check the box for Trendline.
Change the Type to Logarithmic.
Under Label, select Use Equation.
Step 4: Extract the Equation
Look at the legend of your chart. You will see an equation that forecasts conversions based on a spend input.
(Example: -53.1 + 11.4 ln x)
Step 5: Forecast Sales at Different Spend Levels
Now, use that equation to build a calculator in your spreadsheet.
Create a new table with columns for "Future Spend", "Forecasted Conversions", “CPA”, and “Marginal CPA”.
In the ‘Forecasted Sales’ column, enter the formula based on your equation.
If your equation is -53.1 + 11.4 ln x, and your ‘Future Spend’ starts in cell F19, your formula to forecast conversions would be = -53.1 + 11.4 * LN(F19).
Drag this formula down to see how sales growth tapers off as you increase spend.
Step 6: Find the breakeven spend based on marginal cost & LTV
1. Calculate Marginal CPA between spend tranches
In your new table table with forecasted conversions, look at a higher spend level (Tranche B) and compare it to the one directly above it (Tranche A).
Formula: =(Spend B - Spend A) / (Conversions B - Conversions A)
In plain english this is saying “take the difference in spends divided by the difference in conversions”. This will give you your marginal cost.
2. Compare Marginal CPA to your LTV (The Breakeven Point) Drag this calculation down your entire table. As your spend increases, your Marginal CPA will climb.
Green Light: As long as Marginal CPA < LTV, you are still buying profitable growth.
The Wall: The moment Marginal CPA = LTV, you have hit your "Efficiency Ceiling."